MLB · AL West
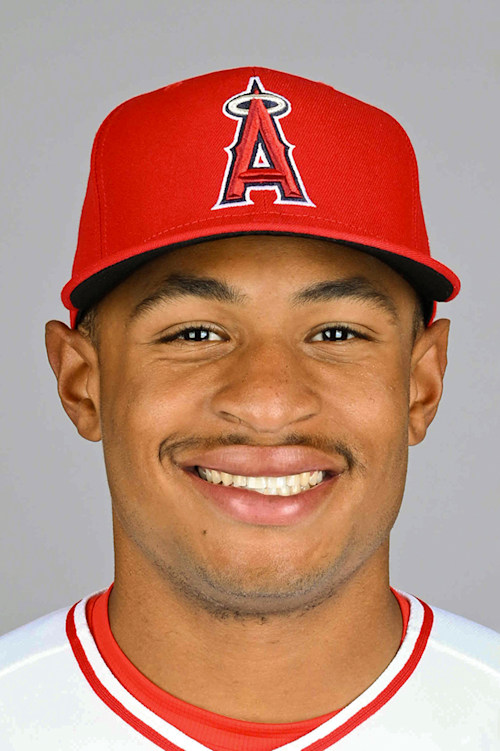
Christian Moore
Betting stats, Statcast splits, spray chart & prop matchups
FormSteady
Prop hit rates
How often Christian Moore has cleared each prop line over his last 10 and 30 games and the season.
Hits
share of games clearedL10L30Season
- Over 0.567%67%67%
- Over 1.50%0%0%
- Over 2.50%0%0%
Home runs
share of games clearedL10L30Season
- Over 0.50%0%0%
Total bases
share of games clearedL10L30Season
- Over 1.50%0%0%
- Over 2.50%0%0%
- Over 3.50%0%0%
Research any hitter with the prop-research tool.
At a glance
AVG
.200
OBP
.227
SLG
.200
OPS
.427
HR
0
K%
50%
Last 10: 4-for-20 (.200) · 0 HR · 11 K · 1 BB · MLB avg .247 / .318 / .404
Where he hits it
20%
Pull
50%
Center
30%
Oppo
Pull-air 0% of BIP
Share of batted balls by field sector. The pull / center / oppo split and pull-side fly-ball power sit below the fan.
Matchups
vs LHP.422OPS10 PA
vs RHP.432OPS12 PA
By pitch type. Filter by pitch, opposing hand, or recency. Green beats league average, red falls short.
Window
1 pitch · this season · vs left-handed pitchers
Full Statcast profile
Expectedestimators not shown above
xBA
.417
xSLG
.535
Batted ballAvg EV / Barrel% / Hard-hit% shown above
Max EV
107.3
EV90
106.3
Launch angle
15.6°
Sweet-spot%
40.0%
Avg distance
481 ft
EV on barrels
107.3
EV on hard-hit
102.0
Plate disciplineChase% & Whiff% shown above as percentiles
Z-Swing%
86.0%
O-Contact%
23.1%
Z-Contact%
76.7%
Contact%
64.3%
SwStr%
21.5%
CSW%
28.0%
In-zone%
53.8%
1st-pitch swing%
45.5%
2-strike K%
66.7%
Rolling formxwOBA(con) / K% / BB% / Barrel% / Whiff%
7d xwOBA(con)
.351
7d K%
30.8%
7d Barrel%
12.5%
7d Whiff%
28.1%
14d xwOBA(con)
.375
14d K%
50.0%
14d Barrel%
10.0%
30d xwOBA(con)
.375
30d K%
50.0%
30d Barrel%
10.0%
By countxwOBA(con) / Whiff% by count state
0-0 xwOBA(con)
.149
Ahead xwOBA(con)
.316
Behind xwOBA(con)
.775
2-strike xwOBA(con)
.467
Ahead Whiff%
20.0%
2-strike Whiff%
43.5%
By situationxwOBA(con) by base state + leverage + inning
Bases empty
.270
RISP
.000
Loaded
.000
High leverage
.170
Clutch
.875
Innings 1-3
.241
Innings 4-6
.305
Innings 7+
.600
Statcast-derived from our v8 pitch corpus, refreshed daily. xwOBA (con) = xwOBA on balls in play. Percentages are share of the relevant opportunity.
Learn the betting side
How to bet on baseball: the complete MLB guide →Baseball's bets, from the run line to props, and the three things that move every number: pitching, the park, and the weather.How to read baseball stats for betting: OBP to xwOBA →A bettor's guide to baseball stats: what to read past the batting average and ERA, which numbers predict the future, and how Statcast measures it.MLB run line explained: baseball's 1.5-run spread →The run line is baseball's spread, fixed at 1.Betting MLB totals: pitchers, parks, and weather →An MLB over/under is set by three things: the starting pitchers, the ballpark, and the weather.