The short version
Why sharp bettors care more about the closing line than the final score, and how to measure your own CLV in a way that tells you if your process actually works.
Closing line value (CLV), the gap between the odds you bet at and where the market settled at kickoff, is the only stat in sports betting that proves you have an edge before the games are even played. Win rate, ROI, profit: all of those need hundreds of bets to mean anything. CLV starts telling the truth in a fraction of that.
What CLV measures
The closing line as truth-source
The closing line is the price the market settles on right before kickoff or first pitch. It is the last set of odds offered at the major sportsbooks before action stops. By the time it lands, every sharp syndicate, every professional bettor, every model with serious money behind it has had a chance to push the line where it should be. The closing line is the consensus truth-source for what a bet was actually worth.
Closing line value (almost always shortened to CLV) is the gap between the price you bet at and that closing price. If you got a side at +120 and it closed at +100, you bought it 20 cents cheaper than the consensus eventually agreed it was worth. That gap is your CLV on that bet.
Why it’s independent of the result
CLV says nothing about whether your bet won. It says everything about whether you were on the right side at the right price. A losing bet with positive CLV is a sign of process; a winning bet with negative CLV is luck. Over the long run, the bettor logging more of the first kind is the one with edge, even if the scoreboard for any given weekend suggests otherwise.
The CLV formula
American odds to implied probability
CLV is the difference in implied probability between your bet and the close. The two American-odds conversion formulas:
- Positive odds:
100 ÷ (odds + 100) - Negative odds:
|odds| ÷ (|odds| + 100)
Worked example
You bet a team at +120; the line closes at +100:
| Stage | Implied probability |
|---|---|
| Your bet (+120) | 45.5% |
| Closing line (+100) | 50.0% |
| CLV | +4.5 points |
You bought the side at 45.5% when the market eventually priced it at 50.0%. That’s +4.5 percentage points of CLV on that single bet. Most CLV trackers report it in basis points (1 percentage point = 100 basis points), so the same bet would log as +450 bps. Same number, different unit.
Why CLV beats W/L over small samples
The math article in this series shows how a true 53% bettor can post win rates anywhere from 43% to 63% over 100 bets, purely from variance. A genuine edge takes about 1,000 bets to confirm through wins and losses, three to four months of full-time action before you can even say your record proves anything.
CLV converges almost an order of magnitude faster:

| Sample size | Bets to prove edge |
|---|---|
| From win rate / ROI | ≈ 1,000 bets |
| From CLV | ≈ 100 bets |
The reason: CLV doesn’t depend on the games resolving your way. Whether your bet won has nothing to do with whether the line moved toward you. You can lose a bet with +500 bps of CLV and win one with −300 bps. Over a long enough sample, the CLV side is what tells you whether your process is sound.
It’s why pros track CLV first and W/L second. Wins pay the bills. CLV tells you whether the bills are going to keep getting paid.
No-vig closing prices
Why the vig has to come out
There’s a subtle thing most CLV beginners miss. The closing odds on each side of a bet include the book’s juice. A close of −110 on both sides of a spread doesn’t mean the market thinks the bet is a 50/50. It means the market thinks it’s a 50/50 and the book is taking ~4.8% margin on top. The actual consensus probability is 50% on each side, not the 52.4% the −110 prices imply.
How to strip the juice
To measure CLV correctly, you have to strip the juice from the closing prices before comparing. The standard four-step conversion:
- Convert both sides of the closing market to implied probability.
- Add them up. They’ll exceed 100% (that’s the vig).
- Divide each side’s implied prob by the sum.
- You now have the no-vig closing probability, the market’s honest read.
Worked example. The closing market on a spread is −110 / −110.
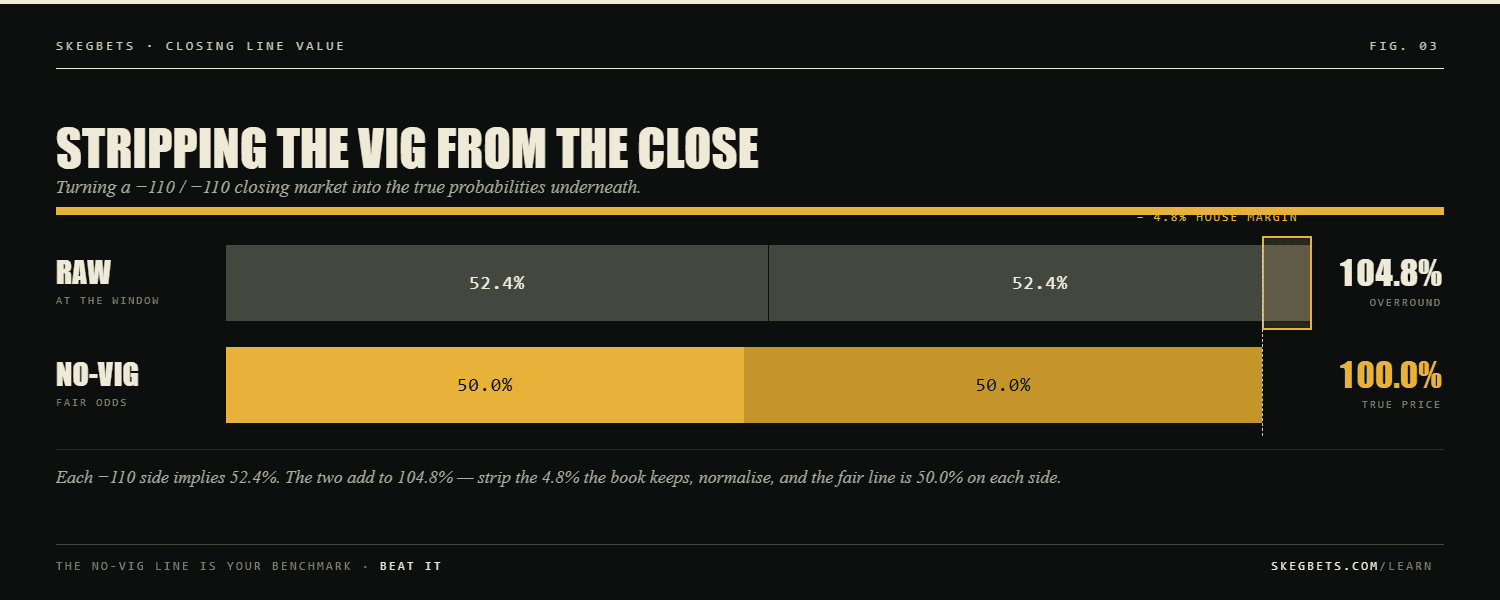
| Step | Result |
|---|---|
| Raw implied (favorite) | 52.4% |
| Raw implied (underdog) | 52.4% |
| Sum (= 1 + vig) | 104.8% |
| No-vig favorite | 50.0% |
| No-vig underdog | 50.0% |
Your CLV is then measured against the no-vig close, not the raw close. Otherwise every bet looks artificially good: you’re getting credit for beating a price that included the house’s margin, which isn’t real value. We strip vig the same way on every pick we publish, which is why our CLV numbers report honestly rather than flatteringly. A prediction market skips this step entirely. Its price is already a no-vig probability.
What good CLV looks like
Sharp, square, and suspicious
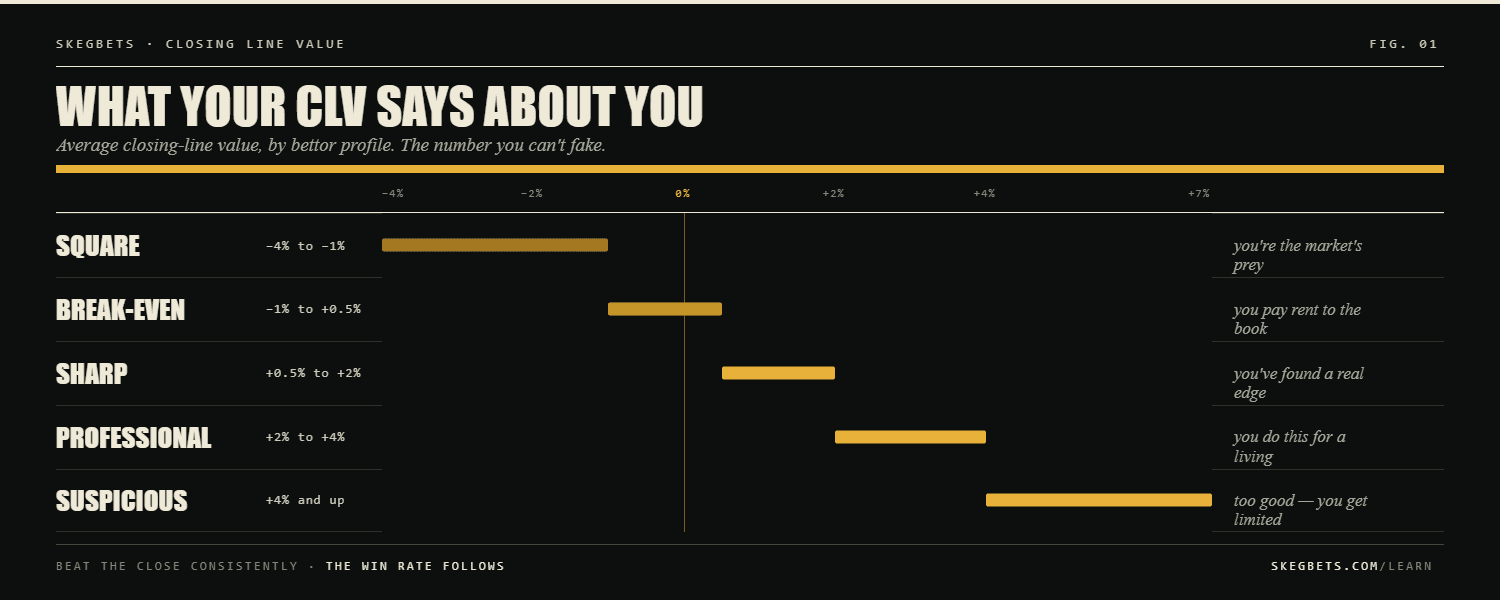
Sustained CLV benchmarks across a few thousand bets, after vig is stripped, mapped to bettor skill level:
| Tier | Average CLV | What it says about you |
|---|---|---|
| Square | −4% to −1% | You're the market's prey |
| Break-even | −1% to +0.5% | You pay rent to the book |
| Sharp | +0.5% to +2% | You've found a real edge |
| Professional | +2% to +4% | You do this for a living |
| Suspicious | +4% and up | Too good to be true; you get limited |
That last row is real. CLV that high over a long sample is almost always a measurement error. Usually someone is tracking against the raw close instead of the no-vig close, or using opening prices from soft books and closes from sharp books. If your reported CLV is +5% over a few hundred bets, the first thing to check is your math; the second is whether your sportsbook is about to start limiting your action.
A bettor running +1% CLV across a sustained sample is, in roughly the same neighborhood, posting around +1% ROI, give or take, depending on the bet types and how late they get to market. CLV and ROI track each other closely once samples are large enough; CLV just gets there first.
How to track your own CLV
The five-column spreadsheet
Open a spreadsheet. Five columns is enough to compute CLV across any sample size:
- Bet odds: the price you actually bet at.
- Closing odds (your side): what your side closed at.
- Closing odds (other side): needed for the no-vig conversion.
- No-vig closing prob: calculated from columns 2 and 3.
- CLV in bps: your bet’s implied prob minus the no-vig closing prob, times 10,000.
Running mean of column 5 is your CLV. After 100 bets, you have a real signal on whether your process is sharp. After 1,000, you have a diamond-hard answer.
Where to get closing-line data
For closing-line data, the sportsbooks themselves are the source of truth. The Odds API publishes historical odds going back years and is the simplest off-the-shelf option; a few pick-tracking apps offer it as a built-in feature. Either way, make sure the “closing” snapshot you record was taken within the final 15 minutes before tip-off or first pitch. Earlier snapshots haven’t had the sharpest money come in yet.
Why we publish CLV on every pick
Every pick we publish gets an opening-line snapshot frozen at generation time. When the game closes, we re-measure the line, compute the no-vig close, and log the CLV in basis points against that snapshot, the same math you’d use on your own bets. The running average is the single best public-facing answer to “does your model actually beat the market?”
It also keeps us honest. If our CLV is flat or negative, our process isn’t finding inefficiencies and the picks are coin flips regardless of whether last week’s record looked nice. CLV is a leading indicator on the model’s health; W/L is a lagging one. Both matter. Tracking only the lagging one is what most pick services do. And it’s why most pick services can’t survive long enough to be evaluated honestly.
Every resolved pick we’ve ever published is on the public archive, with the result attached. The CLV side of that ledger is internal today and surfaces in our weekly recap; pulling it onto every article page is on the near-term roadmap.
Track this, not your record
Closing line value is the answer to the question every bettor secretly asks themselves: how do I know if I’m actually any good at this, before the variance has had time to sort me out? The market gives you a closing price that’s been pushed by millions of dollars of sharper money than yours. Beat it consistently, measured cleanly with the vig stripped, and you have a real edge, even if last weekend went 2-7.
Don’t love the bet that won at −2% CLV. Love the bet that lost at +4%. Over enough samples, the second one pays the bills.
Beating the close starts with the price you take, so line shopping and betting at the right time are how you actually earn it. For the edge CLV stands in for, see expected value, and for the variance and bankroll side, read the math of sports betting.
Frequently asked questions
What is closing line value (CLV) in sports betting?+
Closing line value is the difference between the odds you bet at and the final odds the market settled at right before kickoff. If you bet a team at +120 and the line closed at +100, you beat the closing line. That's positive CLV. It's the cleanest signal that you bought a position the market eventually agreed was underpriced.
How do you calculate closing line value?+
Convert your bet price and the closing price to implied probabilities. Subtract closing from your bet. A bet at +120 implies 45.5% win probability; a close at +100 implies 50.0%. You bought the side 4.5 percentage points cheaper than the market eventually priced it. That's your CLV on that bet, expressed in percentage points of implied probability.
What's a good CLV for a sports bettor?+
Sharp bettors average around +0.5% to +2% of CLV over a sustained sample. +2% to +4% is professional-tier and worth defending. Anything materially above +4% over a real sample size is almost always a measurement error. Negative CLV means the market is moving against your bets on average. Your edge is at best zero and probably negative once juice is included.
Why is CLV more important than win rate?+
Because CLV is a far faster signal than win rate. Variance can paint a profitable bettor as a loser over 100 bets and an unprofitable one as a winner. The closing line is a much sharper truth-source, with millions of dollars of money flowing into it before the game starts. If you consistently beat it, you have an edge, even if the games haven't resolved your way yet.
Does positive CLV guarantee profit?+
No. Variance still applies. Positive CLV says your process is finding underpriced lines; profits show up over enough bets for the underlying win rate to express itself. Most professional bettors will tell you to track CLV first and ROI second, because CLV converges fast and ROI converges slow.
Free tools